Network Traffic Monitoring with RRDTool
This page details the use of RRDTool for
monitoring the network traffic through one or more network interfaces.
Background
See my Installing RRDTool page for detailed info on
installing and configuring RRDTool.
Note that this page assumes all directories and installation locations are
as per the page mentioned above.
If your configuration is different, you may need to adjust some parts of the installation instructions appropriately.
Screen Shots
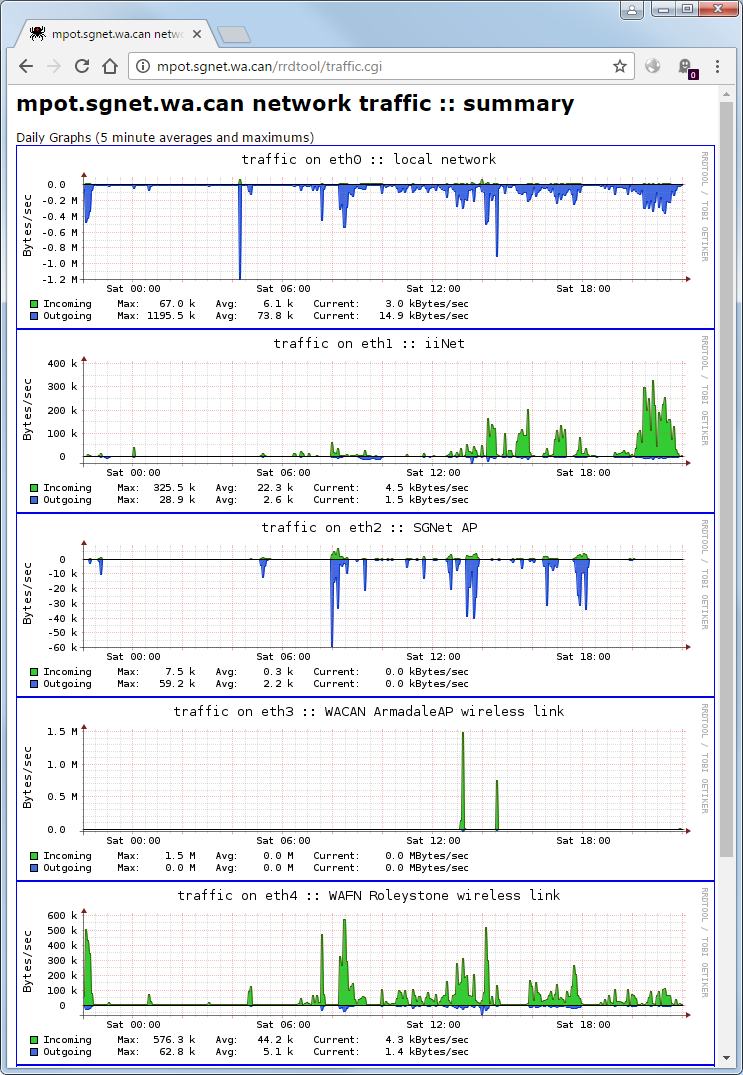
Here's a screen shot of the summary page. This page shows the summary daily graphs
for each interface being monitored (click image for larger version).
the summary page
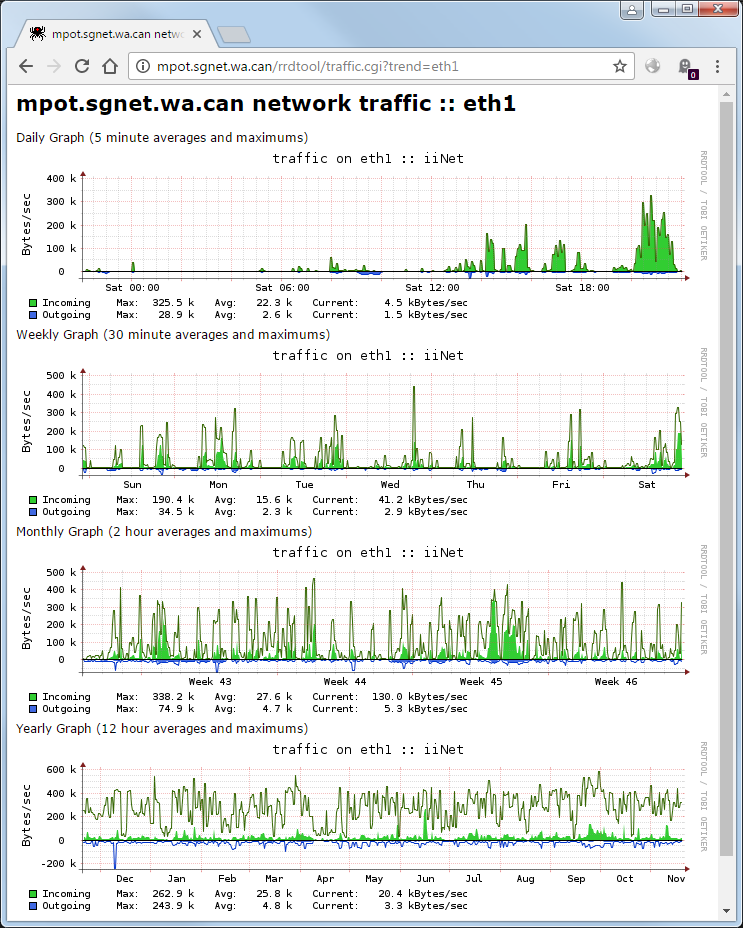
And here's a screen shot showing the daily, weekly, monthly and yearly graphs for one of the
interfaces (click image for larger version).
daily, weekly, monthly, yearly graphs
Note that green trend is the incoming traffic,
and the blue trend is outgoing traffic, shown as negative traffic on the graph.
This allows both incoming and outgoing traffic to be easily shown on the same axis,
and still be very readable.
The solid section of the weekly / monthly / yearly graph shows the average traffic values,
while the green and blue lines show the maximum traffic values.
Requirements
You'll need:
-
a Linux box
-
a web server running on the Linux box
- a working installation of RRDTool, including the shared RRD perl module
-
my rrd_traffic.pl script for data collection
and graph generation
-
my traffic.cgi webpage for viewing the graphs
-
an SCP client (such as WinSCP
or FileZilla)
for copying files onto your linux box.
-
a way of getting a command-line prompt on your linux box
(either by logging directly onto your linux box,
using a SSH client such as
PuTTY
or SSH Secure Shell).
Note that the information on this page was originally written for configuring traffic monitoring on
Red Hat 7.3 linux, but has since been updated for
Ubuntu linux.
If your configuration is different, you may need to adjust some parts of the script
appropriately.
Getting Data
The first task is to determine how to obtain the data we want to insert
into the RRD database.
Some shell scripting can easily be used to obtain the items of information
required. The statements below will return the bytes in and out
respectively for the specified interface (eth0):
ifconfig eth0 |grep bytes|cut -d":" -f2|cut -d" " -f1
ifconfig eth0 |grep bytes|cut -d":" -f3|cut -d" " -f1
Run these from a command prompt to verify they return some rather large numbers.
Note that these numbers are the cumulative total throughput of the interface.
These totals will wrap around, and start again at zero, but RRDTool only
looks at the difference in the value since the last time an update was
performed.
According to the RRDTool
documentation,
you're supposed to use COUNTER for these types of data,
but I've found RRDTool generates large spikes in the graphs if the traffic counters
are unexpectedly reset (ie, when you reboot your linux box).
Using DERIVE doesn't assume an overflow if the counter value
has decreased, eliminating the spikes. However, it can mean you'll get
a value of zero after a reboot (which is perferable to a large spike, as the spike tends
to upset the scale of the graphs).
Automating Data Collection
To automate data collection, I wrote a Perl script which performs the following tasks:
- create RRD database for any specified network interface
- retrieve data for any specified network interface
- store data into the RRD database
- generate daily, weekly, monthly and yearly graphs
You can download a copy of my
rrd_traffic.pl script.
Rename it to rrd_traffic.pl, and save it in
/usr/local/bin/.
Make it executable by changing the file permissions on it:
chmod 755 /usr/local/bin/rrd_traffic.pl
and adjust the settings defined at the top of the script to make them appropriate
for your linux box (and make sure these directories exist):
# define location of rrdtool databases
my $rrd = '/var/lib/rrd';
# define location of images
my $img = '/var/www/html/rrdtool';
The following lines in rrd_traffic.pl
specify for which network interfaces data will be collected.
Add/modify/delete any lines here as appropriate (lines can be commented
out with a "#" character).
# process data for each interface (add/delete as required)
&ProcessInterface("eth0", "local network");
&ProcessInterface("eth1", "internet gateway");
&ProcessInterface("eth2", "MartinMast wireless link");
&ProcessInterface("eth3", "home wireless");
One of my linux boxes has four interfaces (eth0 through
to eth3), hence the ProcessInterface
function is called four times; once for each interface.
Also specify the description of each interface. This description will be
printed on the top of each graph generated by this script.
Test the script by executing it from a command prompt:
/usr/local/bin/rrd_traffic.pl
The first time the script is run, it'll create an RRD database for each
interface, so you should see output similar to this (assuming the script has been configured
to monitor eth0 and eth1):
[root@elrond root]# /usr/local/bin/rrd_traffic.pl
eth0 traffic in, out: 3943533024, 2835946527
creating rrd database for eth0 interface...
eth1 traffic in, out: 2677344039, 3794523343
creating rrd database for eth1 interface...
On any subsequent executions, you should see similar output, but without the
creating rrd database...... lines.
Once you've verified the operation of the script, it can be automatically
scheduled to run periodically. To get it to run every 5 minutes,
add the following to
/etc/crontab:
# get network interface traffic details
*/5 * * * * root /usr/local/bin/rrd_traffic.pl >/dev/null
Note that if you find your graphs are being created, but with no data, it's probably
because your cron paths aren't setup to include paths to all of the
shell commands used in rrd_traffic.pl.
To correct this, you'll have to either:
- edit /usr/local/bin/rrd_traffic.pl to reference the full pathname
for ifconfig, cut and
grep,
or
- edit the PATH
definition in /etc/crontab to include the
paths of those commands.
Viewing the Graphs
Each time the script is executed, if required, it'll update the graphs of
traffic graphs.
These graphs are being created in /var/www/html/rrdtool/,
and assuming you've got a webserver running, they'll be accessible via
http://your_ip/rrdtool/.
To provide a much cleaner way to view these graphs, I've written a simple
webpage for displaying all the graphs.
You can download a copy of my
traffic.cgi webpage.
Rename it to traffic.cgi, and save it in
/var/www/html/rrdtool/.
Make it executable by changing the file permissions on it:
chmod 755 /var/www/html/rrdtool/traffic.cgi
and adjust the settings defined at the top of the script to make them appropriate
for your linux box, in particular, the interface name:
# define graphs to display (add/remove as required)
push (@graphs, "eth0");
push (@graphs, "eth1");
push (@graphs, "eth2");
push (@graphs, "eth3");

# get the server name (or you could hard code some description here)
my $svrname = $ENV{'SERVER_NAME'};
Note that I'm assuming you've got your web server appropriately configured
to handle .cgi scripts. if not, refer to the
inline documentation in your httpd.conf or the Apache
documentation for more information.
You should now be able to point your web browser at
http://your_ip/rrdtool/traffic.cgi and you should
be rewarded with a page displaying the summary traffic graphs for each network interface.
Clicking any of the daily graphs will then display the detailed graphs for that interface,
ie, the daily, weekly, monthly and yearly graphs.
Comments on Data Storage
This script uses a separate RRD database to hold the traffic details for each
network interface. The rrd_traffic.pl script uses
the following code to create the RRD database:
RRDs::create "$rrd/$_[0].rrd",
	"-s", "300",
	"DS:in:DERIVE:600:0:U",
	"DS:out:DERIVE:600:0:U",
	"RRA:AVERAGE:0.5:1:576",
	"RRA:AVERAGE:0.5:6:672",
	"RRA:AVERAGE:0.5:24:732",
	"RRA:AVERAGE:0.5:144:1460";
This creates an RRD database with the following attributes:
- 5 minute step (base interval with which data will be fed into the RRD)
- 2 data sources (in, and out)
- 10 minute heartbeat for each data source
- 2 days of 5 minute averages
- 2 weeks of 1/2 hour averages
- 2 months of 2 hour averages
- 2 years of 12 hour averages
Refer to the
rrdcreate manpage for more information on these options.
References
Installing RRDTool
Wireless Link Monitoring with RRDTool
About RRD Tool
RRD Tool Documentation
last updated 24 Mar 2026
|