Serial Port Temperature Sensors - Graphing Temperatures
This page describes the scripts to allow temperature values to be
historised into an RRDTool database, and how to generate graphs of the temperature.
Note that this page assumes the use of digitemp on linux.
Similar Windows software is available, and
RRDTool is also available for Windows, so converting the code shown on this page
to run on a Windows PC is certainly feasible (and is left as an exercise for the reader).
Background
See my Installing RRDTool page for detailed info on
installing and configuring RRDTool.
Note that this page assumes all directories and installation locations are
as per the page mentioned above.
If your configuration is different, you may need to adjust some parts of the installation instructions appropriately.
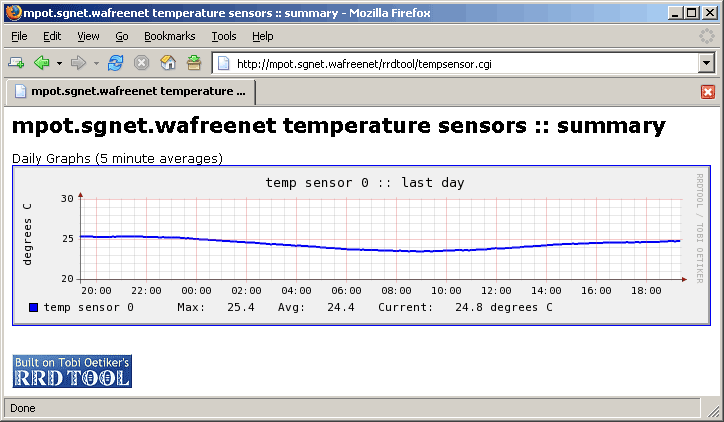
Screen Shots
Here's a screen shot of the summary page, showing a graph for a single temperature sensor
for the last 24 hours.
temperature graph for last 24 hours
The sample web page provided below also allows weekly, monthly and yearly graphs to
be viewed.
Requirements
You'll need:
-
a Linux box
-
a web server running on the Linux box
- a working installation of RRDTool, including the shared RRD perl module
-
my rrd_tempsensor.pl script for data collection
and graph generation
-
my tempsensor.cgi webpage for viewing the graphs
-
an SCP client (such as WinSCP,
or SSH Secure File Transfer Client, part of
SSH Secure Shell)
for copying files onto your linux box.
-
a way of getting a command-line prompt on your linux box
(either by logging directly onto your linux box,
using a SSH client such as
PuTTY
or SSH Secure Shell).
Note that I'm using a custom installation of
Red Hat 9.0 linux.
If your configuration is different, you may need to adjust some parts of the script
appropriately.
Getting Data
The first task is to determine how to obtain the data we want to insert
into the RRD database.
Some shell scripting can easily be used to obtain the items of information
required.
The statement below will return just the numerical temperature for sensor 0 in degrees Celsius:
digitemp -t 0 -q -c /etc/digitemp.conf -o%C
Automating Data Collection
To automate data collection, I wrote a Perl script which performs the following tasks:
- create RRD database for any specified sensor
- retrieve data for any specified sensor
- store data into the RRD database
- generate daily, weekly, monthly and yearly graphs
You can download a copy of my
rrd_tempsensor.pl script.
Rename it to rrd_tempsensor.pl, and save it in
/usr/local/bin/.
Make it executable by changing the file permissions on it:
chmod 755 /usr/local/bin/rrd_tempsensor.pl
and adjust the settings defined at the top of the script to make them appropriate
for your linux box (and make sure these directories exist):
  # define location of rrdtool databases
  my $rrd = '/var/lib/rrd';
  # define location of images
  my $img = '/var/www/html/rrdtool';
The following lines in rrd_tempsensor.pl
specify for which sensor data will be collected.
Add/modify/delete any lines here as appropriate (lines can be commented
out with a "#" character).
  # process data for each sensor (add/delete as required)
  &ProcessSensor(0, "temp sensor 0");
  #&ProcessSensor(1, "temp sensor 1");
  #&ProcessSensor(2, "temp sensor 2");
You can also specify the description of each sensor. This description will be
printed on the top of each graph generated by this script.
Test the script by executing it from a command prompt:
/usr/local/bin/rrd_tempsensor.pl
The first time the script is run, it'll create an RRD database for each
sensor, so you should see output similar to this (assuming the script has been configured
to monitor eth0 and eth1):
  [root@gimli root]# /usr/local/bin/rrd_tempsensor.pl
  sensor 0: 25.38 degrees C
  creating rrd database for temp sensor 1...
  sensor 1: 25.40 degrees C
  creating rrd database for temp sensor 1...
On any subsequent executions, you should see similar output, but without the
creating rrd database...... lines.
Once you've verified the operation of the script, it can be automatically
scheduled to run periodically. To get it to run every 5 minutes,
add the following to
/etc/crontab:
  # get temperature sensor readings and create graphs
  */5 * * * * root /usr/local/bin/rrd_tempsensor.pl >/dev/null
Note that if you find your graphs are being created, but with no data, it's probably
because your cron paths aren't setup to include paths to all of the
shell commands used in rrd_tempsensor.pl.
To correct this, you'll have to either:
- edit /usr/local/bin/rrd_tempsensor.pl to reference the full pathname
for digitemp and cut,
or
- edit the PATH
definition in /etc/crontab to include the
paths of those commands.
Viewing the Graphs
Each time the script is executed, if required, it'll update the temperature graphs.
These graphs are being created in /var/www/html/rrdtool/,
and assuming you've got a webserver running, they'll be accessible via
http://your_ip/rrdtool/.
To provide a much cleaner way to view these graphs, I've written a simple
webpage for displaying all the graphs.
You can download a copy of my
tempsensor.cgi webpage.
Rename it to tempsensor.cgi, and save it in
/var/www/html/rrdtool/.
Make it executable by changing the file permissions on it:
chmod 755 /var/www/html/rrdtool/tempsensor.cgi
and adjust the settings defined at the top of the script to make them appropriate
for your linux box, in particular, the sensor name:
  # define graphs to display (add/remove as required)
  push (@graphs, "temp0");
  push (@graphs, "temp1");
  #push (@graphs, "temp2");

  # get the server name (or you could hard code some description here)
  my $svrname = $ENV{'SERVER_NAME'};
Note that I'm assuming you've got your web server appropriately configured
to handle .cgi scripts. if not, refer to the
inline documentation in your httpd.conf or the Apache
documentation for more information.
You should now be able to point your web browser at
http://your_ip/rrdtool/tempsensor.cgi and you should
be rewarded with a page displaying the summary graphs for each temperature sensor.
Clicking any of the daily graphs will then display the detailed graphs for that sensor,
ie, the daily, weekly, monthly and yearly graphs.
Comments on Data Storage
This script uses a separate RRD database to hold the details for each
sensor. The rrd_tempsensor.pl script uses
the following code to create the RRD database:
	RRDs::create "$rrd/temp$_[0].rrd",
		"-s", "300",
		"DS:temp:GAUGE:600:U:U",
		"RRA:AVERAGE:0.5:1:2016",
		"RRA:MIN:0.5:1:2016",
		"RRA:MAX:0.5:1:2016",
		"RRA:AVERAGE:0.5:6:1344",
		"RRA:MIN:0.5:6:1344",
		"RRA:MAX:0.5:6:1344",
		"RRA:AVERAGE:0.5:24:2190",
		"RRA:MIN:0.5:24:2190",
		"RRA:MAX:0.5:24:2190",
		"RRA:AVERAGE:0.5:144:3650",
		"RRA:MIN:0.5:144:3650",
		"RRA:MAX:0.5:144:3650";
This creates an RRD database with the following attributes:
- 5 minute step (base interval with which data will be fed into the RRD)
- 1 data source (called temp)
- 10 minute heartbeat for the data source
- 7 days of 5 minute averages, minimums and maximums
- 4 weeks of 1/2 hour averages, minimums and maximums
- 6 months of 2 hour averages, minimums and maximums
- 5 years of 12 hour averages, minimums and maximums
all in a 75 kilobyte file.
Refer to the
rrdcreate manpage for more information on these options.
last updated 24 Mar 2026
|