|
|
Conifer Antenna Testing II
(first published September 2002)
This page details the testing method and results when comparing
a number of different Conifer dipole modifications.
Background
We first did some testing of different Conifer antenna modifications
in March 2002.
This time, we decided to get a few more people involved, and test a
larger number of modified Conifer feedhorns - this time testing a
total of 13 feedhorns.
Martin (aka mpot), Marcus, Peter (aka peterh), and Steve (aka [Steve])
all assisted with the testing, with Martin and Steve supplying the
vast majority of the modified feedhorns for the testing.
Test Equipment
We used two laptops, one at either end of our wireless link.
The specs for the laptop at the remote end:
- Pentium 150 with 64Mb RAM, 2.1Gb HDD
- Enterasys RoamAbout wireless card (with 6.04 firmware)
- Windows 95 OSR2
- Enterasys 7.44 drivers and client utility
- running on mains power for the duration of the tests
The specs for the laptop at the antenna end:
- Pentium III 1GHz with 256Mb RAM
- Enterasys RoamAbout wireless card (with 6.04 firmware)
- Windows 2000 SP2
- Enterasys 7.44 drivers and client utility
- running on mains power (via an inverter in my car)
We had the following antenna hardware:
- 24dBi Conifer grid
- 1.8m antenna mast
- 13 modified Conifer feedhorns
Modified Feedhorns
A total of 13 modified feedhorns were tested. I've named them uniquely as follows:
|
name
|
description
| |
m1
|
common pcb dipole,
2.5m RG-213 coax (referred to as "Feedhorn #1" in the previous previous test results),
using firm contact connection between coax core and centre brass tube
| |
m3
|
custom copper/brass dipole, 2.5m CNT-400 coax
(referred to as "Feedhorn #3" in the previous test results)
using soldered connection between coax CORE and centre brass tube
| |
m4
|
custom copper/brass dipole, ~10m CNT-400 coax
using soldered connection between coax CORE and centre brass tube
| |
m5
|
custom copper/brass dipole, 2.5m RG-213 coax
| |
s1
|
common pcb dipole, 1m 9006 coax
| |
s2
|
common pcb dipole, 0.5m 9006 coax
| |
s3
|
"bad" pcb dipole, 0.5m 9006 coax
| |
s4
|
custom copper/brass dipole, 0.5m CNT-400 coax
| |
s5
|
custom copper/brass dipole, 0.5m 9006 coax
| |
s6
|
custom copper/brass dipole, using thin-diameter copper, 0.5m 9006 coax
| |
s7
|
custom copper/brass dipole, using thin-walled brass, 0.5m CNT-400 coax
| |
s8
|
pcb dipole, with rotated copper sections, 0.5m 9006 coax
| |
p1
|
pcb dipole, 1m 9006 coax (suffered water ingress while on the MartinMast for several months)
|
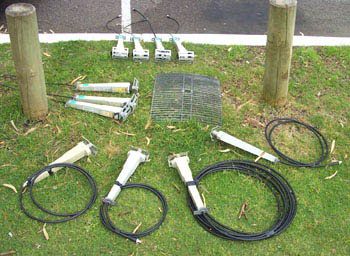
a large selection of modified Conifer feedhorns
(note that we didn't use the 18dBi Conifer dish also shown)
All dipoles prefixed with an "m" were constructed by myself, all dipoles
prefixed with an "s" were constructed by Steve (with the exception of "s1"),
and "s1" and "p1" were constructed by Peter.
Test Setup
The test setup was the same as used for the last tests
that we performed several months ago.
However, this time, the P150 laptop was in the office (with no external antenna),
and we used a PIII 1GHz laptop in the carpark (with the modified Conifer antenna).
We then set-up our test rig in a car park approx 300-400m away from the office
building, with clear line-of-sight to the laptop in the office, through a
gap in the trees.
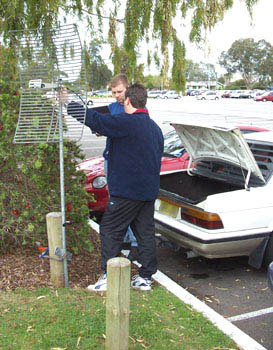
the test rig with 24dBi antenna on the mast
(Martin is holding the laptop, Steve (facing away) is supervising)
As we didn't want the mast to move during the testing, as this would introduce
additional variables and unknowns into the test results, we used a couple
F-clamp to clamp the mast to a convenient pole, and aimed the antenna at the office window.
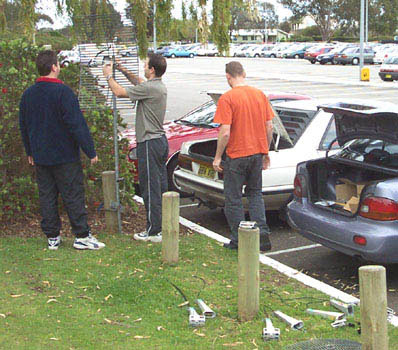
Marcus swapping a feedhorn, Steve supervising,
Peter walking away from camera
For all tests, the antenna was mounted so it was horizontally polarised.
Note that the laptop in the office window did not have an external antenna connected,
so the polarisation of the antenna shouldn't matter.
Testing Methodology
A feedhorn was bolted to the grid, and connected to the laptop using a pigtail.
For consistency, the same pigtail was used for all the feedhorns.
The antenna was connected to the wireless card in the laptop using an appropriate
pigtail, and the wireless card was configured to operate in ad-hoc mode, with
the same SSID as the other laptop.
The "Link Test" mode in the Enterasys Client Utility was used to monitor the link strength,
with each test configuration being monitored for a couple of minutes.
the Enterasys Client Utility displaying link statistics
Once the reported link details had stabilised, the SNR, signal strength and noise
level were recorded for both the local and remote ends of the link
were recorded.
The Cient Utility was also configured to log these details once per second for
approximately 1 minute for each feedhorn.
After testing each feedhorn, we then re-tested the first two feedhorns,
to verify that the environmental conditions hadn't changed sufficiently
to affect the results.
For each of these two feedhorns, the results were virtually identical to
the results from our earlier test, indicating neglible change in environmental
conditions or antenna orientation.
Test Results & Calculations
The Enterasys Client Utility was used to log the connection details at both the local
and remote ends of the wireless link, at 1 second intervals.
For each 1 second interval, the minimum, maximum and average values were logged for the
SNR, signal and noise levels.
The average of the 1 second average values for local and remote SNR, signal and noise was calculated.
The feedhorns tested used a number of different types and lengths of coax.
In an effort to normalise the data, I've calculated the loss associated with each length of coax,
and added this loss to the local SNR, resulting in a normalised SNR for each feedhorn.
This allows me to compare the results without having to worry about the losses caused
by the different types and lengths of coax.
Note that I'm assuming the signal and noise are both attenuated by the same
amount due to the cable losses.
In reality, lossy cable or longer lengths of cable will introduce additional
noise, resulting in a lower SNR.
Also note that I'm assuming the losses caused by the N connector termination are equal for each feedhorn.
In reality, there may be some difference in loss between the different N connectors used, and the
care and skill used when terminating the coax.
The following cable attenuation figures were used:
|
cable type
|
attenuation (dB/m)
| |
RG-213
|
0.5
| |
9006
|
0.4
| |
CNT-400
|
0.22
|
For each feedhorn, I calculated the theoretical cable losses, as shown
in the table below
|
|
cable losses
| |
feedhorn
|
length (m)
|
type
|
loss (dB)
| |
m1
|
2.5
|
RG-213
|
1.3
| |
m3
|
2.5
|
CNT-400
|
0.6
| |
m4
|
10.0
|
CNT-400
|
2.2
| |
m5
|
2.5
|
RG-213
|
1.3
| |
s1
|
1.0
|
9006
|
0.4
| |
s2
|
0.5
|
9006
|
0.2
| |
s3
|
0.5
|
9006
|
0.2
| |
s4
|
0.5
|
CNT-400
|
0.1
| |
s5
|
0.5
|
9006
|
0.2
| |
s6
|
0.5
|
9006
|
0.2
| |
s7
|
0.5
|
CNT-400
|
0.1
| |
s8
|
0.5
|
9006
|
0.2
| |
p1
|
1.0
|
9006
|
0.4
|
Due to lack of test data for the s5 and s6 feedhorns, I won't include them in my conclusions,
but I have included them below.
This table shows the SNR, normalised noise and signal strengths, for both the
local and remote ends, for each feedhorn.
|
|
local
|
remote
| |
feedhorn
|
SNR (dB)
|
signal (dBm)
|
noise (dBm)
|
SNR (dB)
|
signal (dBm)
|
noise (dBm)
| |
m1
|
25.2
|
-72.8
|
-98.0
|
22.8
|
-71.8
|
-94.7
| |
m3
|
27.3
|
-72.4
|
-99.7
|
24.5
|
-71.4
|
-95.7
| |
m4
|
24.9
|
-72.9
|
-97.8
|
20.3
|
-73.2
|
-93.4
| |
m5
|
23.8
|
-72.8
|
-96.6
|
21.7
|
-72.5
|
-94.2
| |
s1
|
21.0
|
-76.3
|
-97.3
|
19.2
|
-75.9
|
-95.1
| |
s2
|
25.1
|
-73.2
|
-98.2
|
21.4
|
-73.7
|
-95.0
| |
s3
|
25.8
|
-73.2
|
-98.9
|
22.6
|
-72.8
|
-95.4
| |
s4
|
27.2
|
-74.0
|
-101.2
|
23.8
|
-71.8
|
-95.6
| |
s5*
|
24.0
|
-72.8
|
-97.8
|
23.0
|
-72.8
|
-94.8
| |
s6*
|
25.0
|
-72.8
|
-96.8
|
24.0
|
-71.8
|
-94.8
| |
s7
|
23.4
|
-73.6
|
-96.9
|
22.7
|
-73.4
|
-96.0
| |
s8
|
23.4
|
-75.1
|
-98.5
|
22.4
|
-72.8
|
-95.2
| |
p1
|
19.6
|
-77.2
|
-96.9
|
18.2
|
-77.1
|
-95.2
|
* Note that only one sample value was logged for these feedhorns, so the results for these
feedhorns are only for a single instant in time, while the results for the other feedhorns
are averaged over a 30-60 second period.
Comments
Despite the same testing environment, the results are slightly lower than those recorded in
the previous tests, but this is due to a different
orientation of the laptop in the office. As we're only comparing results recorded on the same day,
this won't affect the calculations or conclusions.
The m1, s1, s2, s3 feedhorns all used the original pcb dipole.
With the exception of s1, they all performed similarly, with the
SNR varying by approximately 1 dB between them.
However, the signal strength of m1 was slightly higher than that recorded for
s1 and s2, but the noise was also slightly higher.
We later discovered that the dipole in s1 had come loose, which its poor performance.
The s8 feedhorn used a relatively rare pcb dipole, which has the two brass plates
making up the dipole rotated 90 degrees. The feedhorns using this dipole appear to be newer
than the more common pcb dipole, and have a red Conifer sticker instead of a yellow Conifer sticker.
Our testing indicates that this dipole performed poorly compared to the more common pcb dipole,
with the SNR being about 1.5-2dB lower. The signal level was lower than
the other pcb dipoles, but the noise level was similar.
The s7 dipole was constructed using thin-walled brass, but the results show it with an SNR
at least 3dB less than the other copper/brass dipoles, due to a higher noise level.
The p1 feedhorn consists of a pcb dipole, but performed much more poorly than the similar
feedhorns. It had been mounted on the MartinMast for several months, and had suffered
water ingress. The water damage certainly affected the performance, with the SNR being
about 5-6dB less than the other similar dipoles, caused by a much lower signal level,
but a similar noise level.
The dipoles in m3, m4, m5, and s4 were made using the same method, and there's
minimal variation in the SNR between m3, m4 and s4.
The m4 dipole has similar signal strength as that recorded for m3, but
has more noise, which is probably a result of the additional 7.5m of coax
attached to it.
The m5 dipole has an SNR approx 2dB lower than the others, but has similar
signal strength, but more noise,
and is probably caused by bad soldering on the dipole, as it has a similar signal
level, but more noise.
Interestingly, m3 and s4 have very similar SNRs, but m3 has a higher signal level,
as well as a higher noise level, indicating a higher sensitivity.
The SNR at the remote end for m3 is 0.7dB higher than that recorded for s4.
Conclusions
The test results clearly indicate that the copper/brass dipole performs better than the pcb dipole.
The best performing copper/brass dipoles were m3, with a local SNR of 27.3dB and
remote SNR of 24.5dB,
and s4, with a local SNR of 27.2dB and remote SNR of 23.8dB.
The best performing pcb dipole was s3, with a local SNR of 25.8dB and remote SNR
of 22.6dB.
In other words, there's a measured 1.5dB improvement in SNR at the local end
for the best performing copper/brass dipole, compared to the best performing pcb dipole.
Looking at the remote end, the SNR for m3 is 1.9dB higher than that of s3.
Comparing the local signal and noise levels for m3 and s3 indicates that
m3 has 0.8dBm higher signal, and 0.7dBm less noise, while at the remote end,
m3 has 1.4dBm higher signal, and 0.3dBm less noise.
A 1.5dB gain is an increase of approximately 41%, and a 1.9dB gain is an
increase of approximately 55%.
Both these increases in SNR are certainly significant, so if
you've currently got a marginal signal with a pcb dipole modification,
it's certainly worth constructiong a copper/brass dipole.
Our previous tests indicated a difference of approximately 3dB
between the copper/brass dipole and the pcb dipole.
However, the test results shown above include a much larger sample set of dipoles, and
more accurate measurements, as we're using the average signal strength as logged by the Client
Utility at 1 second intervals, over a 30-60 second period. In the previous tests, we monitored
the signal strength, and estimated the average values over a short period of time.
Even if dipoles are constructed in identical ways, using identical materials, there can still
be upto 2dB difference in SNR.
I'd suggest this is due to the quality (or lack of) of the soldering on the dipole,
and possibly the angle of the nose cone reflector.
Our previous tests indicate that it's possible to gain
or lose 1-2dB by varying the angle of the reflector on the nose cone.
References
Conifer Antenna Testing (part 1)
Modifying Conifer Antennas for Wireless Networking
Antenna Cable Comparison
Credits
Photos by and
graphics by .
last updated 22 Oct 2013
|
|
|
|

